What's Inside
- Inside the Patch: Channels, Dyes and Ion-Selective Electrodes
- One Square of Forearm Skin Versus the Whole Body
- Heat, Sunscreen, Swollen Ducts and the Bathroom Scale
- Paying per Patch and Fighting for the CSV
- A Four-Workout Baseline You Can Actually Compare
Inside the Patch: Channels, Dyes and Ion-Selective Electrodes
Human eccrine sweat is roughly 99% water. Everything a biochemical sweat patch reports comes from the sliver left over, a thin dissolved fraction dominated by sodium and chloride. That is the raw material: a few microliters of salty water, pulled off a small patch of skin.
Follow the sample and the device becomes much less mysterious. Sweat enters a collection inlet pressed against the skin, then advances through microfluidic channels etched into a flexible layer. From there, designs split into two families. Colorimetric patches route the fluid past reagents that change color as it reacts, and the wearer photographs the patch with a smartphone so the app can read the endpoint. Electrochemical patches put the fluid in contact with ion-selective electrodes that a small reader samples electronically. The review of microfluidic sweat sensing mechanics is a good primer on how these channel geometries control flow.
The sensing method matters for your log. A photographed color endpoint, a series of channel-fill images, and continuous electrode sampling each give the timestamp a different meaning. Record which one produced every number.
Two numbers, two fields
Strip away the app's dashboard and a patch captures two distinct things:
- Local volumetric sweat rate, expressed in microliters per square centimeter per minute. As a calculated illustration, 12 microliters collected across 2 square centimeters in 10 minutes works out to 0.6 µL/cm²/min. Those are example inputs, not a performance claim for any device.
- Local sodium concentration, expressed in millimoles per liter.
They describe different properties and belong in separate columns of any quantified self log. One millimole of sodium is about 23 milligrams of sodium, which is a different quantity from the same numerical mass of sodium chloride. Mixing those up is the most common unit error in hobbyist spreadsheets.
One Square of Forearm Skin Versus the Whole Body
Marketing copy tends to promise "real-time hydration status." The device's actual position in the measurement chain is far more modest, and it is worth tracing it link by link.
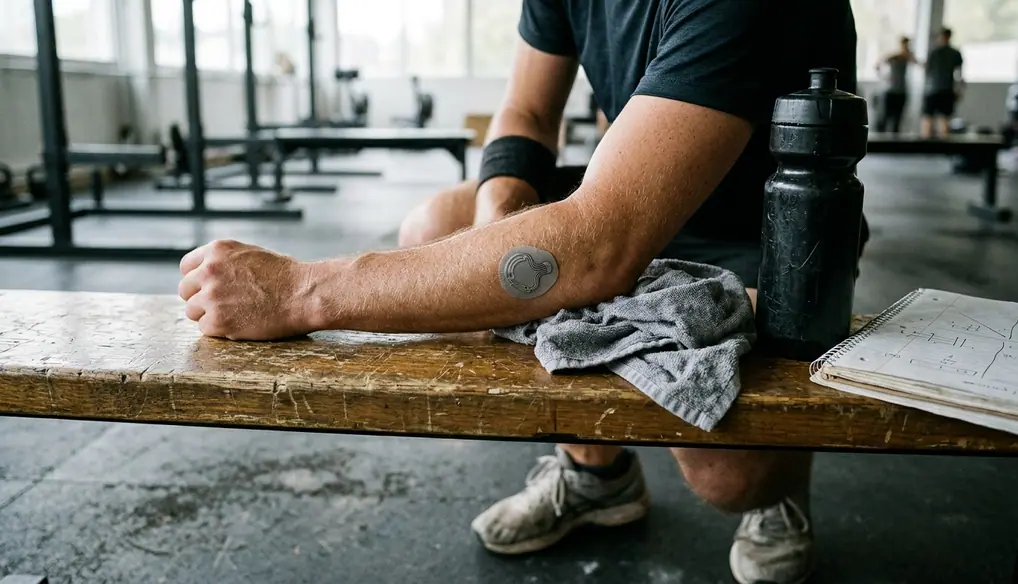
A forearm patch samples secretion from the skin directly beneath its inlet. Turning that into a whole-body fluid-loss figure requires a regional conversion model. Turning that into a statement about systemic hydration requires another inference stacked on top. Three quantities, then: local sweat secretion, modeled whole-body sweat loss, and systemic hydration status. Each step adds assumptions the wearer never sees.
Placement compounds the problem. Local sweat rate and electrolyte concentration at the inner forearm do not uniformly mirror whole-body fluid loss, and a lower-back patch samples a different site entirely. Treat them as separate windows, each needing its own conversion, rather than two views of one body-wide value.
Why sodium jumps when you push harder
A sodium spike is not a plasma-osmolality alarm. As exercise intensity climbs and eccrine secretion speeds up, the sweat duct has less time to reabsorb sodium on its way to the surface, so the patch reading rises. Internal plasma osmolality may not have shifted to anything like the same degree. The app sees saltier sweat before anything has established systemic dehydration.
Concentration also cannot stand alone as a loss figure. A reading of 40 mmol/L converts to roughly 920 milligrams of sodium per liter of sampled sweat. That number says nothing about milligrams lost per hour until it is paired with a sweat-volume estimate, and the log should preserve whether that volume was local or modeled whole-body.
Read the Alert Literally: consumer epidermal patches cannot measure blood plasma osmolality directly. When the app flags you, read the alert as a local fluid-loss estimate and keep drinking to your plan instead of treating it as a clinical dehydration diagnosis.
Lag deserves its own bookkeeping. Log three separate timestamps: exercise start, first visible channel filling, and first reported concentration. The gaps between them expose your device's collection delay without leaning on some universal figure that may not apply to your body or your patch.
Heat, Sunscreen, Swollen Ducts and the Bathroom Scale
Raw patch telemetry sits inside an environment that constantly pushes on it. Ambient temperature and relative humidity change how fast you secrete and how fast the surface evaporates. Airflow matters more than most people expect: an indoor trainer with a fan at hip height and an outdoor ride into a headwind produce very different local moisture conditions at the sensor. Then there is clothing. A sleeve or jersey layered over the patch builds a microclimate that traps moisture right where the inlet is trying to sample.
The skin surface brings its own noise. Lotion, sunscreen, and dried salt crystals left from yesterday's session can skew an electrochemical baseline before fresh sweat even arrives. Adhesive edges lift, letting surface sweat wick in from outside the collection area. And during long, wet sessions, hidromeiosis sets in: the outer skin swells and partially blocks sweat ducts, so local output drops for reasons unrelated to your fluid status.
The independent check: dry nude mass
Every patch reading needs a referee, and the cheapest, most trustworthy one is a precision scale. This completes the forearm-to-bottle accounting chain: channel fill measures local volume, the electrode estimates concentration, and dry nude mass supplies an independent whole-body fluid-loss comparison.
The calculation:
- Estimated sweat loss (kg) = pre-exercise mass − post-exercise mass + fluid consumed (kg) − urine passed (kg).
- Divide by exercise duration in hours.
- For practical logging, treat 1 kilogram of water as 1 liter.
Worked example: 70.20 kg before, 69.65 kg after, 0.40 kg of drink consumed, no urine during 60 minutes. That gives 0.95 kg of sweat loss, or roughly 0.95 liters per hour.
Use a digital scale that displays 0.05- or 0.1-kilogram increments, place it on the same hard surface every time, and check repeat readings before starting. Display resolution and measurement accuracy are separate specifications; a scale can show two decimals and still drift.
If the app reports whole-body liters per hour, compute a session correction ratio: mass-balance rate divided by app rate. Summarize the four paired ratios across your baseline. If you are working with raw local flux instead, keep a unit-bearing mapping from µL/cm²/min to whole-body L/h rather than pretending it is a dimensionless multiplier.
Keep Salt Separate: the correction ratio belongs to fluid volume only. Store sodium concentration as its own measured field and never quietly apply the fluid correction to it.
Paying per Patch and Fighting for the CSV
Optical wearables follow a familiar pattern: buy once, charge, reuse for years. Biochemical sensing breaks that model. Depending on the design, the microfluidic collector, the adhesive assembly, or the hydrogel electrode interface goes in the bin after every session. The useful metric is cost per interpretable session, rather than the sticker price of the reader.
The arithmetic is simple. Consumable spend equals patch count multiplied by delivered per-patch cost, including shipping and any tax. Track the reader hardware on a separate line so repeat-testing costs stay visible. A four-session baseline uses four patches. Testing three workouts a week for six weeks uses 18.
Those scenarios point toward when high-frequency logging earns its keep: a seasonal heat acclimation block, or the long-run phase of a marathon build, when your sweat response is genuinely changing and the answer could alter your fueling plan. Continuous daily tracking outside those windows mostly buys the same baseline number over and over.
The export bottleneck
For anyone building a lifelogging stack, the harder cost is data ownership. Many proprietary apps output a simplified "sweat profile" or a milligram replacement target and stop there. No time series, no raw CSV, no sensing method recorded.
A workable personal schema looks like this. One session record holds start time with UTC offset, patch site, patch identifier, exercise duration, local sodium concentration, reported sweat loss, mass-balance sweat loss, environmental conditions, and export type. Join it to the workout's GPX or FIT file by session identifier and start time, keeping power in watts, heart rate in bpm, and core temperature in °C when those streams were actually recorded. Attach the session-end sweat summary once, at the session level, instead of smearing it across every second of the activity file. And label the app's recommended sodium intake differently from its measured sodium concentration, because the first is advice and the second is data.
A Four-Workout Baseline You Can Actually Compare
Four repeated workouts test repeatability before any trend gets interpreted. The discipline is writing every control down before session one, so nothing gets adjusted after the first numbers come in. These are self-experimentation controls, not a validated clinical protocol.
Schedule and workload
- Four 60-minute sessions, separated by 48 to 72 hours, starting within the same 30-minute window of the day.
- A steady indoor ergometer load you can already sustain, for example 150 watts for a rider comfortable at that output. Repeat it exactly; flat outdoor pacing is a weaker substitute.
- Fan position, fan setting, and clothing unchanged across all four.
Skin prep and placement
- Follow the patch's specified anatomical site and preparation steps. Shave the area if hair prevents a flat seal.
- Clean with an alcohol swab and let the skin dry completely before applying.
- For a forearm-approved patch, measure the inlet's distance from the elbow crease and photograph its orientation. Reuse that measurement every session instead of chasing whichever spot looks sweatiest.
Fluids and environment
- In session one, log your habitual pre-exercise fluid quantity and timing, then reproduce it.
- Weigh the drink bottle before and after each session; log refills and spills.
- Record room temperature and relative humidity at start and finish. If you collect wet-bulb data, use the same instrument and method throughout.
Scale Before Sensors: the mass-balance numbers anchor everything else in this protocol. Without them, four patch readings are four uncalibrated guesses.
So start there. Before you order a multi-pack of microfluidic patches, run one 60-minute steady-state session with nothing but a precision digital bathroom scale and a pre-weighed water bottle, and calculate your baseline gravimetric sweat rate. That single figure tells you what any patch will have to agree with.