When Passive Signals Outrun Daily Decisions
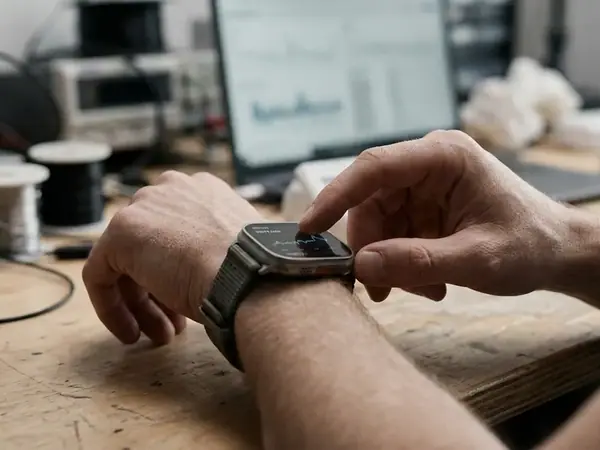
Modern consumer wearables poll physiological sensors throughout the day and night. A wrist device repeatedly acquires optical pulse and motion signals, firmware turns those readings into summaries, and an application adds sleep, activity, recovery, and trend fields. The stream keeps expanding while the person wearing the device may make only one or two relevant lifestyle decisions that day.
Even a device that exposes just one summarized value per minute can generate 1,440 time-stamped values over 24 hours. That arrives before sleep stages, workout records, heart-rate summaries, and manually entered context join the record.
The practical mismatch matters more than the volume itself: sub-minute sensing feeds daily fields that rarely produce a decision within the next 24 hours. Instead of changing a bedtime, taking a walk, or moving a late coffee earlier, the user spends time reconciling scores. Was recovery lower because of poor sleep? Did the sleep score fall because the band shifted? Does yesterday’s activity explain today’s resting pulse? Data management begins to impersonate self-knowledge.
A Saga lifelogging application can preserve a rich account of daily movement and place, but collecting context and interpreting context remain separate tasks. Granularity helps only when it sharpens a question. Without that question, another field often adds another object to inspect.
Run the Relevance Check
For 7 to 10 days, record every dashboard field you open. Beside it, note whether the field prompted a concrete action during the following 24 hours. A field that repeatedly produces no action, useful reassurance, or decision may not deserve daily attention.
This check follows the data path rather than judging the visual design of an app. An elegant dashboard can still contain too much. A plain record can be useful when each entry has a job. The assumption that more granular data automatically creates deeper personal insight breaks at this point: insight depends on relevance, timing, and the ability to act.
The REM Decimal and False Precision
False precision appears when a display presents a number more finely than the underlying sensor can support. An exact REM sleep percentage looks authoritative because it has a unit, a defined category, and sometimes a neat trend line. Yet a consumer wrist device directly observes movement and pulse-related optical changes. It does not directly observe brain activity, eye movements, or chin-muscle tone.

Clinical sleep staging commonly evaluates 30-second epochs using signals that can include electroencephalography, eye-movement channels, and chin-muscle activity. A wrist wearable works from a narrower signal set and infers sleep stages. The distinction between observation and inference tends to disappear once the result reaches a polished morning dashboard.
Read the Number at Sensor Scale
A small change in the REM decimal may reflect ordinary physiological variation, a difference in device fit, unusual movement, alcohol intake, illness, or a shifted sleep schedule. Treating each movement as a meaningful trend can turn a routine morning check into unnecessary anxiety.
- Compare 3 to 5 consecutive nights before interpreting a stage change.
- Check whether the device sat differently on the wrist.
- Note unusual movement, alcohol intake, illness, or a schedule shift.
- Keep the reported stage in proportion to the signals the device actually measured.
The display still has value as a structured estimate. Its typography simply cannot confer measurement certainty.
The scope here is specific: healthy people interpreting consumer dashboards. Continuous, highly precise monitoring can be critical in clinical environments when it addresses a defined chronic condition or acute risk. That setting follows a different decision process, with a specified measurement purpose. Consumer sleep staging used for general self-tracking should be read with more restraint.
When a Sleep Score Starts Directing Sleep
At 04:40, a sleeper wakes and looks at the clock. The alarm is set for 05:00. Rather than turning over or getting up, the person lies completely still for 20 minutes because movement might be classified as wakefulness. The morning score may improve, although the person gained no additional rest.
This is behavioral distortion in a compact form. Once a metric becomes the target, behavior starts serving the algorithm that produces it. A step goal can encourage a useful evening walk; it can also prompt purposeless pacing when the number itself becomes the outcome. The key question is whether the behavior improves the person’s felt state or merely the record.
Count Checks, Then Classify Them
Dashboard fatigue is easy to miss because each individual check feels trivial. Morning sleep review becomes a midday recovery check, followed by an evening inspection of activity rings. Repetition trains attention toward the device and away from hunger, alertness, tension, and fatigue cues.
For 3 to 7 days, tally every app opening and assign it one of three results:
- Action: the reading changed something specific, such as caffeine timing or evening movement.
- Reassurance: the check settled a concrete concern without provoking another check.
- More checking: the reading led to another dashboard, comparison, or inspection without a decision.
The third category deserves attention. A tool intended to strengthen self-awareness can gradually displace it when every sensation requires dashboard confirmation. I treat repeated checking without a decision as a design signal: the metric may need a lower viewing frequency, muted notifications, or temporary removal.
The useful metric remains in dialogue with experience. If the score says “recovered” while the body feels depleted, that disagreement is information. It should prompt examination rather than automatic obedience to the higher-resolution voice on the screen.
Build a Tracking Stack Around One Question
Intentional measurement starts with subtraction. The first pass is a metric audit: disable passive collection and metric notifications for 7 to 10 complete days, including at least one workday and one non-workday pattern. Keep a short decision log during the pause.
The Three-Line Decision Log
- What question arose?
- What action was under consideration?
- Which missing measurement would have changed that action?
Restore only the fields that appear in this log. This reverses the usual setup sequence. Instead of accepting every available measurement and searching for meaning later, the user identifies a decision and then selects the minimum evidence needed to make it.
The audit also exposes imagined dependence. A recovery score may feel essential until several mornings pass without any decision requiring it. Conversely, a basic step count may return quickly because it changes whether someone walks after dinner. The point is functional selection, not digital austerity.
Test the 14:00 Caffeine Boundary
Suppose the unresolved question is whether caffeine timing affects sleep onset. That can become a bounded personal experiment lasting 14 to 18 nights. Use a fixed cutoff such as 14:00 and keep usual lights-out and wake times within a 30-minute band where practical.
The low-friction record contains four daily entries:
- Final caffeine time and serving type.
- Lights-out time.
- Estimated minutes to sleep.
- A 1-to-5 morning energy rating.
This structure links a specific input to a defined outcome while retaining a subjective measure of how the morning actually felt. It also avoids dragging unrelated activity, stress, recovery, and sleep-stage fields into every interpretation.
Stop at the Answer: When the caffeine question has produced a usable decision, end the log. Continuing to collect the same entries out of habit turns a bounded experiment back into passive data hoarding.
The older lifelogging perspective associated with authors such as Kevin Rexroat, Kitty Ireland, and Thursday Bram is still relevant here: a life record becomes meaningful through context. Hypothesis-driven tracking narrows that context deliberately. It asks one question, sets a boundary, observes long enough to compare ordinary days, and then closes the measurement loop.
One Step Count, One Energy Mark
Consider a composite lifelogger who begins each morning reconciling a wrist device, a sleep sensor, a connected scale, and several phone dashboards. Each system assigns its own interpretation to the previous night. The person spends more time resolving disagreements between devices than deciding how to approach the day.
The replacement setup is deliberately small. A basic step counter is checked once after dinner. At 20:30, a physical notebook receives two entries: the total step count and a daily energy score. On the energy scale, 1 means depleted and 5 means unusually energetic.
Keep the Review Bounded
Each daily record fits on one notebook line. After roughly three to four weeks, the entries are reviewed in 7-day blocks. The lifelogger circles clusters, such as two or more low-energy ratings occurring alongside unusually low movement. The weekly review stops after 10 to 15 minutes so the new routine does not become another dashboard ritual.
The setup loses sleep-stage estimates, recovery composites, and competing readiness scores. In return, it provides a direct comparison between movement and felt energy, recorded in terms the person can understand immediately. Dashboard anxiety recedes because there is no stream to supervise throughout the day.

At 20:30 on a quiet Wednesday, the lifelogger reads the step total, writes it beside a circled “2,” and notices the same pairing on Monday’s line. The notebook closes. Walking shoes are placed by the door for the morning.